37Demo
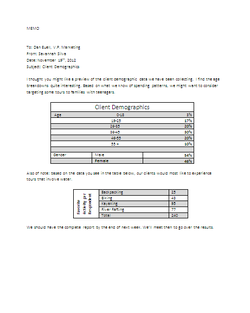
In 37Demo, I had to make a table with very specific data in it. In this assignment I had to also type about the client demographics. Client demographics are how many people like doing specific stuff. In one table it displays ages, the other table displays favorite activities. Learning how to use tables will make life a lot easier when it comes to real life situations. In real life you can use tables to, make grocery lists, make a check list of any sort, organize a group, etc. Learning how to use tables at a young age now is very helpful.
53Voyager
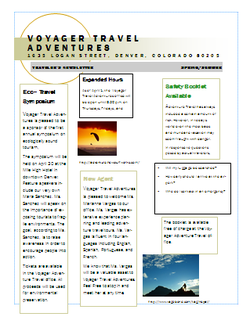
In this assignment, I had to make a three column newsletter. In the newsletter, I had to add information from a page in the book. It could not replicate the page in the book, I had to make it our own. I am used to using Microsoft Word. I have never used Microsoft Publisher before. Also in this assignment, I had to add in pictures that related to the assignment. Since it was about traveling, I decided to make my pictures very scenic. Most of the time when you travel, you go to scenic places. In this assignment though, I had to format boxes and change their color, put in new text boxes, and type in all the information from one document, and put it into the other without making them look similar. That was very difficult for me because everything I tried looked like the original document. In this document I could have did a lot better. In one was was that i could have aligned all the boxes instead of making them so uneven on every thing. The second thing I could have done better was to go with the color theme more. This assignment taught me all about Microsoft Publisher, and how you can do so much, with only a couple resources like the Microsoft programs.
Career Research/ Occupations
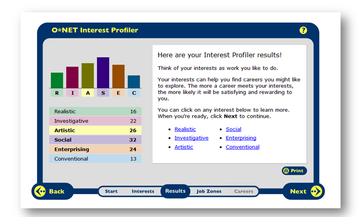
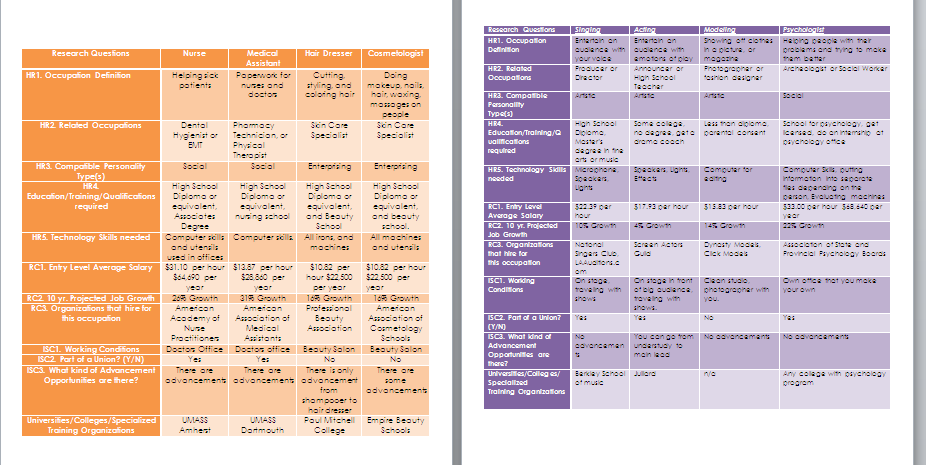
In the assignment for occupation/career research, I had to go on a website, take a quiz and see my occupation outcomes. The occupations are ones that the system thought I should get into based on my answers. Once we got our test results, we had to put a picture of it into a Word Document. After I did that, I had to answer multiple questions about the survey, and what kind of pay there is for the occupations. After we answered all of them, we made a table in a Word Document (displayed below)
This assignment taught me how to make tables in Microsoft Word, and showed an easier way to display information that is much more organized. In this assignment, I feel as if I organized very well, and made it look very colorful and interesting. I could've made sure that my answers were a little bit longer, but other than that, I think I did a pretty good job.
This assignment taught me how to make tables in Microsoft Word, and showed an easier way to display information that is much more organized. In this assignment, I feel as if I organized very well, and made it look very colorful and interesting. I could've made sure that my answers were a little bit longer, but other than that, I think I did a pretty good job.
Teen USA Payroll
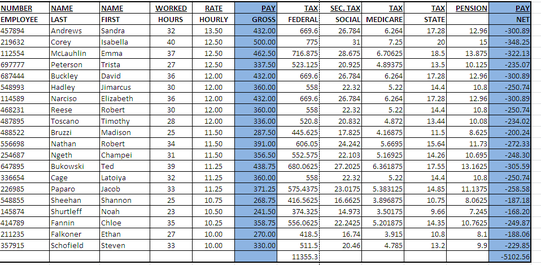
For Teen USA Payroll, I had to use Excel. I had to display information in the table about teens payroll. I had to use formulas to get the gross pay and the net pay. The formulas were very confusing at first for me, but after the first one I understood it. In this assignment, I think I could've made it more colorful and appealing. Other than that, the Excel spreadsheet looks very good in my opinion. I also had to sort the information by hourly rate. I had to sort it from largest to smallest. This assignment was very easy in my opinion since i've worked with Excel before.
